Flood Risk and Your Home: Reading the FEMA Maps in Douglas County

Real Estate Broker · Douglas County, OR
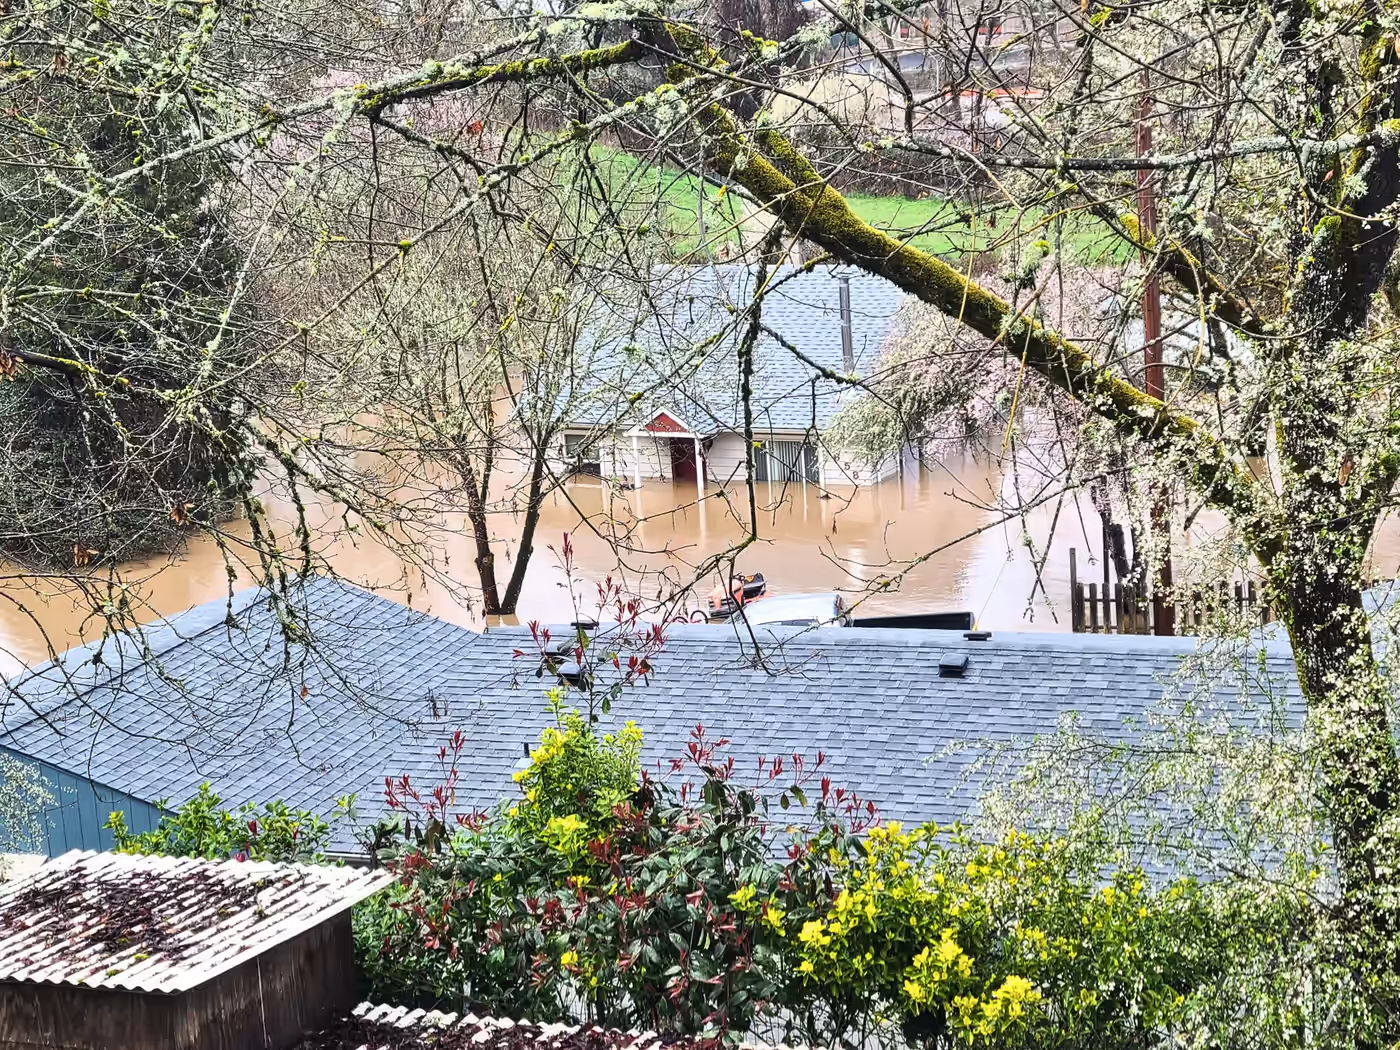
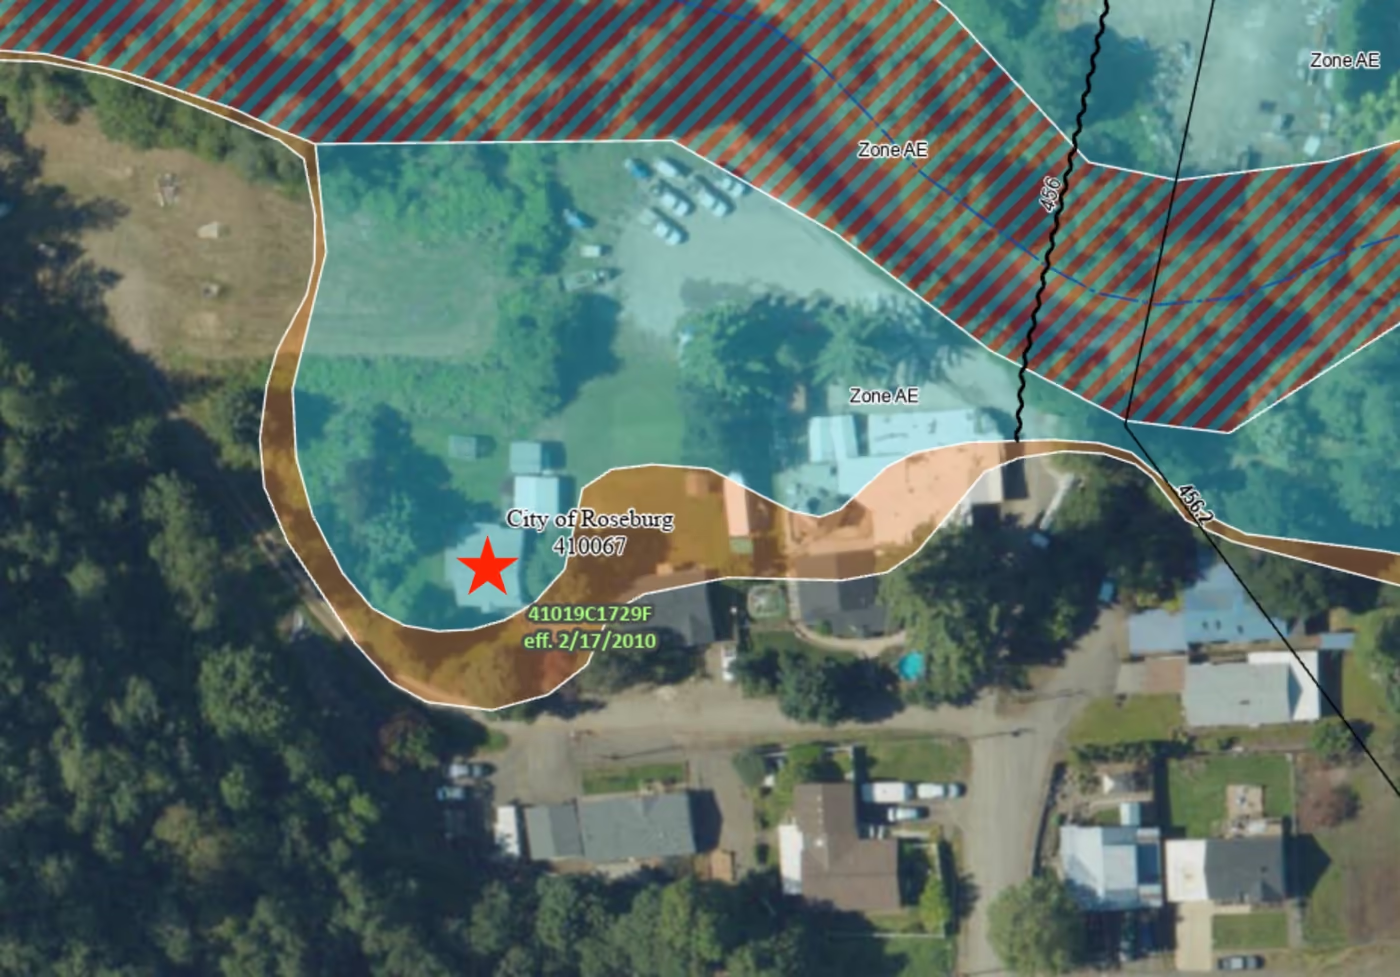
This is my walkthrough of the FEMA flood maps for Douglas County, written after the record-breaking rainfall of March 2025 pushed our rivers and streams over their banks. The FEMA flood maps are broken into 3 categories. The Floodway is the channel of a river or stream plus any adjacent land that must remain open to carry floodwaters. The 100-Year Flood Zone (Zone AE, A, etc.), also called the Special Flood Hazard Area (SFHA), has a statistical 1% chance of flooding in any given year; these areas are high-risk, and flood insurance is typically required if you have a federally backed mortgage. The 500-Year Flood Zone (Zone X shaded) has a 0.2% chance of flooding in any given year, is considered moderate-risk, and flood insurance is optional but may still be recommended.
Sunday, March 16, 2025, will be a day many of us remember for a long time.
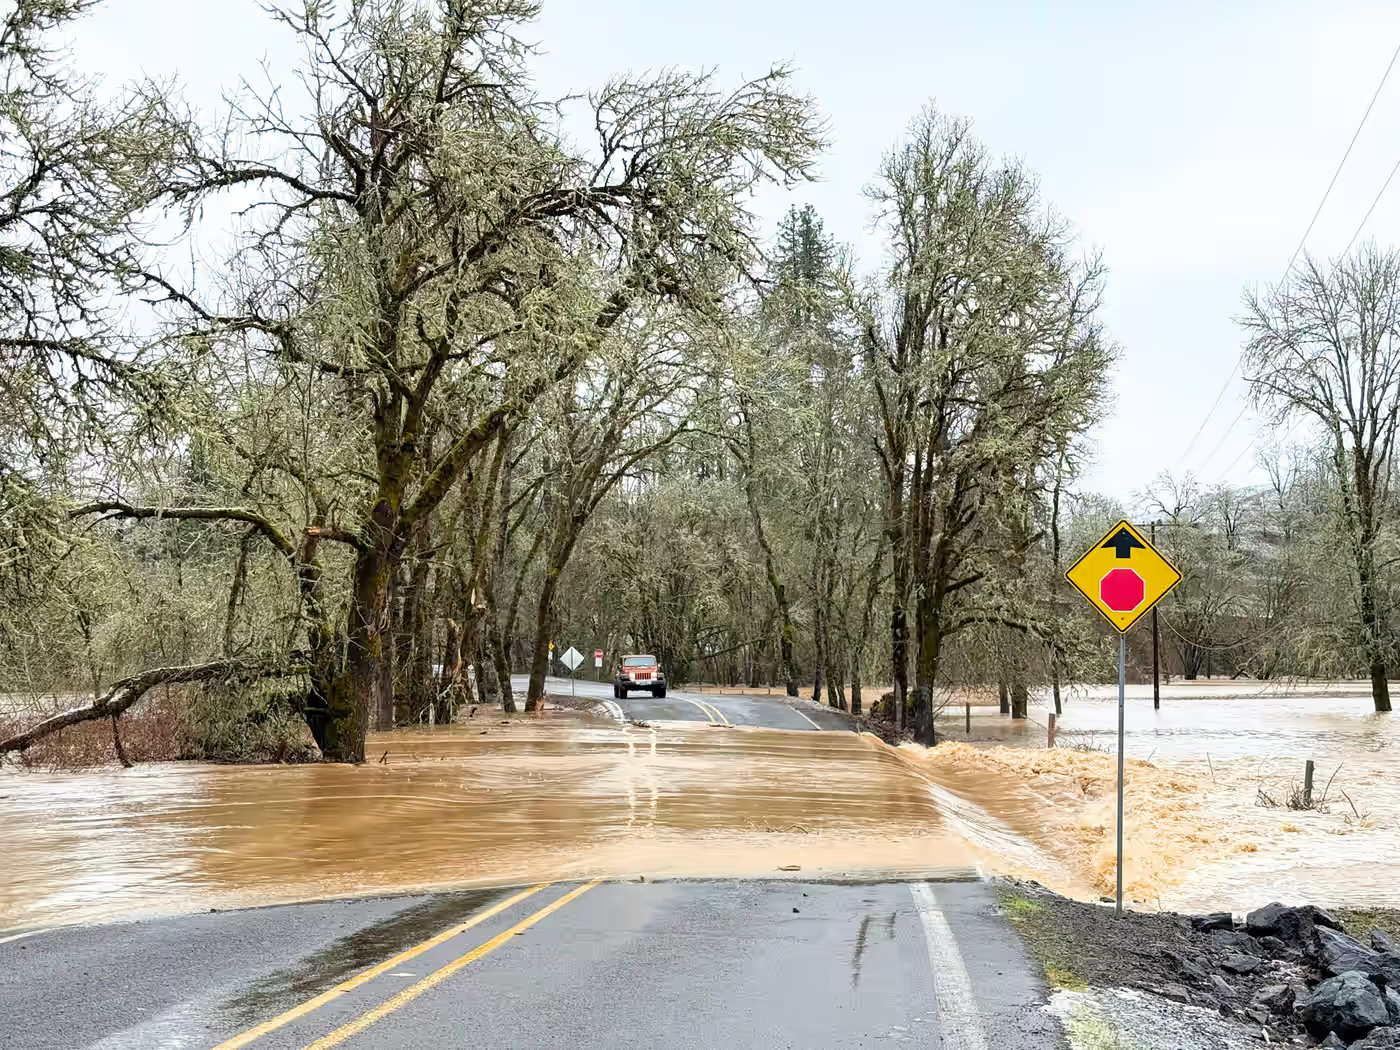
With the sunny weather in April it’s hard to believe just a short few weeks ago we had record-breaking rainfall which made our rivers and streams in Roseburg and Douglas County surge over their banks and flow over the landscape. For some, it was a fascinating event. For others, it was quite devastating. For everyone, it was a reminder that significant flood events are not a joke. Those of us on high ground watched in amazement as the water levels kept rising. For those who lived at lower elevations near the creeks and streams the outcome was not as pretty. Many of our community members experienced significant damage to their homes, property, equipment, and livestock.
If the flooding in March has you wondering how your home and property might be affected by another flood, the easiest way to check is by referring to the statistical flood maps provided by FEMA. The FEMA flood maps are broken into 3 categories:
Floodway
This is the channel of a river or stream plus any adjacent land that must remain open to carry floodwaters.
100-Year Flood Zone (Zone AE, A, etc.)
Also called the Special Flood Hazard Area (SFHA). Has a statistical 1% chance of flooding in any given year. These areas are high-risk. Flood insurance is typically required if you have a federally backed mortgage.
500-Year Flood Zone (Zone X shaded)
Has a 0.2% chance of flooding in any given year. Considered moderate-risk. Flood insurance is optional but may still be recommended.
Housing Inventory
Months of Supply · 12-Month Rolling Average
Roseburg and Douglas County Real Estate (April 2025) Market Update
Aaron’s Real Estate Insights
April 2025 marks exactly 3 years since the end of the hottest Seller’s market on record as measured by the 12-month rolling average [absorption rate](/insights/market-reports). The peak was 77% and lasted roughly 9 months from Aug 2021 - April 2022. The -64.94% drop from 77 to 27 is a significant decrease of 5,000 basis points and accentuated dramatically by the height of the recent Seller’s market. This vital metric will be important to watch as it accurately measures the temperature of the market. If we dip below 20% we will be solidly in a “balanced market” where it neither favors buyers or sellers. If we dip below 15% we will definitely be in a Buyer’s market and that could introduce downward pressure on home prices.
Average Sales Price
12-Month Rolling Average · Douglas County
Related Reading
Douglas County Market
Buyer’s or Seller’s Market?
Housing Inventory is months of supply (active listings ÷ monthly sales). A balanced market is ~6 months. Days on Market (DOM) is days from listing to accepted offer. Absorption Rate is the percentage of inventory sold per month. Balanced = 15-20%.